Since we already have a TIG stack up and running we might as well do something fun with it.
Ever heard of streaming telemetry?
No?
Would you like to?
We no longer have to poll network devices for thousands of data points every few seconds to monitor them, we can just have them report back to us whatever data we want, either on a timer, or when it changes.
Configuration is disarmingly easy.
On your Cisco IOS-XE device you will need to add the following line to enable YANG-based configuration:
netconf-yangAnd then to get a report of incoming and outgoing traffic, every 60 seconds, for all interfaces, just add:
telemetry ietf subscription 2
 encoding encode-kvgpb
 filter xpath /interfaces/interface/statistics/rx-kbps
 stream yang-push
 update-policy periodic 6000
 receiver ip address <telegraf_server_ip> 57000 protocol grpc-tcp
telemetry ietf subscription 3
 encoding encode-kvgpb
 filter xpath /interfaces/interface/statistics/tx-kbps
 stream yang-push
 update-policy periodic 6000
 receiver ip address <telegraf_server_ip> 57000 protocol grpc-tcp
Then on your Influxdb web page create a new Telegraf config for “Cisco Model-driven telemetry”, copy the two lines you’re prompted for in a terminal – and you’re done!
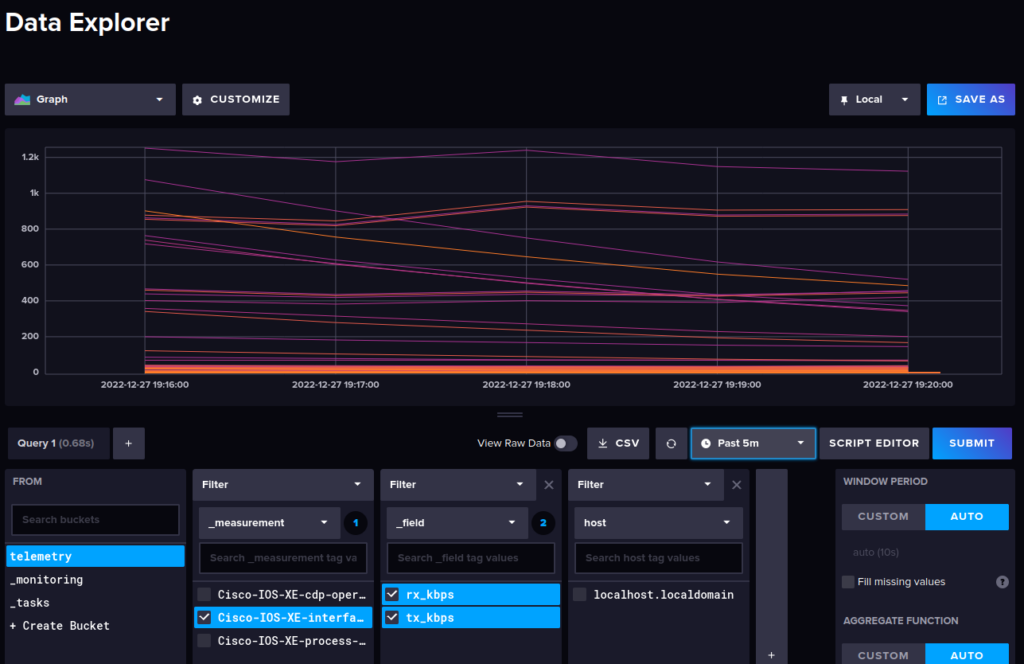
No, really. That’s it.
And you know the best part? This is an open standard, so you will be able to use this across all your machines that support YANG-based streaming telemetry.
Where to get monitoring paths
While “/interfaces/interface/statistics/rx-kbps” is definitely less cryptic than SNMP’s 1.3.180.12.67.30… equivalent, one might wonder where you can get those paths from.
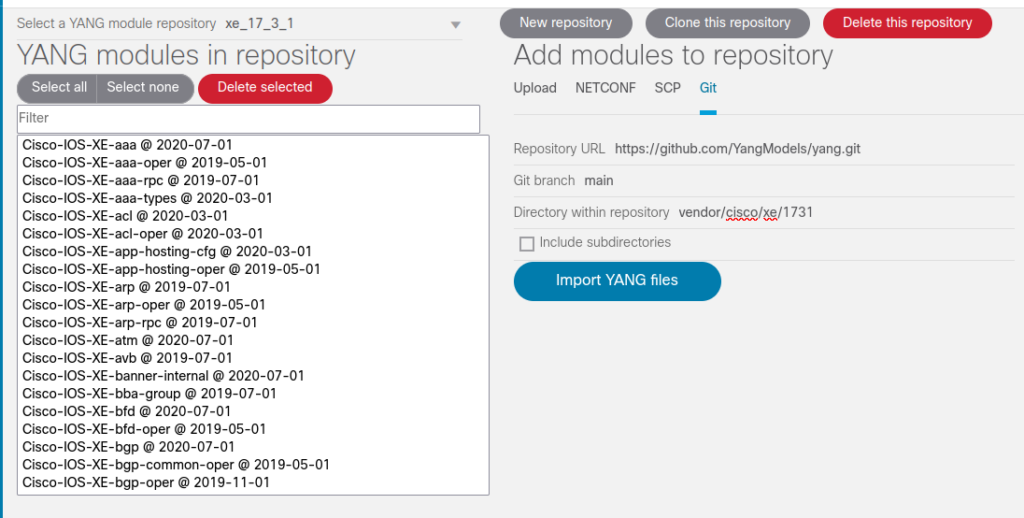
Enter Cisco YANG suite.
Install it locally (you need Docker, it won’t work on Podman, I tried) following the guides
Create a new device, create a new repo, and either import data directly from your own machine or from the public Git repo for YANG, like so:
For example, let’s say we want to monitor power supply status.
Go under Explore -> Yang.
We’re looking for something called power so… power?
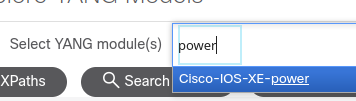
Yes!
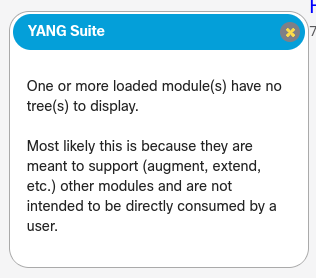
..no.
Alright, this is not an exact science. What about going letter by letter… “po”?
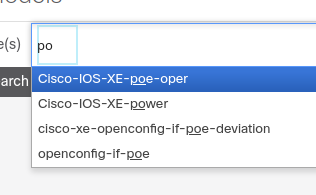
Hey look!
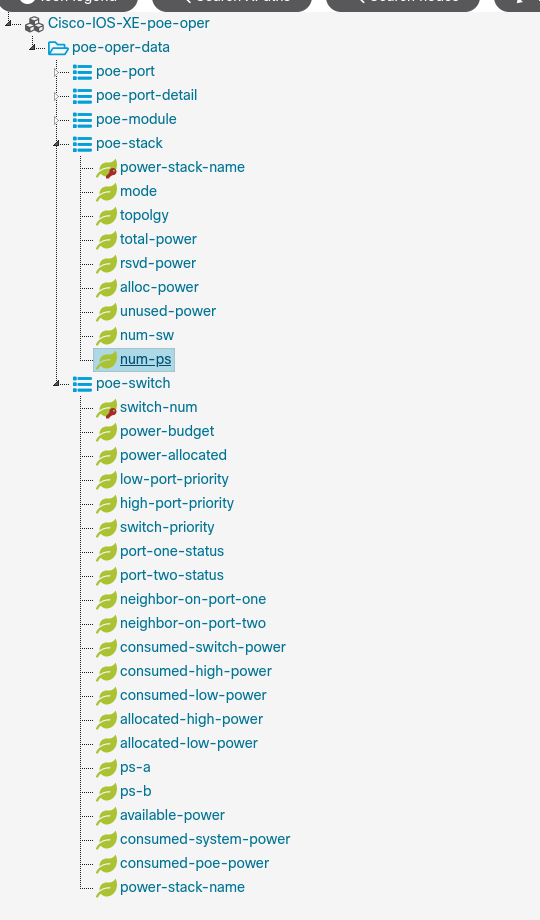
Let’s say we want to get all the juicy data from “poe-switch”.
Well it’s just a matter of getting its xpath…
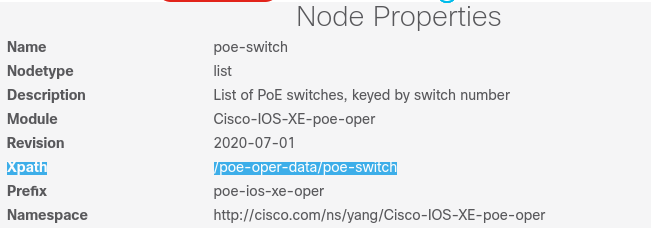
And putting it in the conf
telemetry ietf subscription 5
encoding encode-kvgpb
filter xpath /poe-oper-data/poe-switch
stream yang-push
update-policy periodic 100
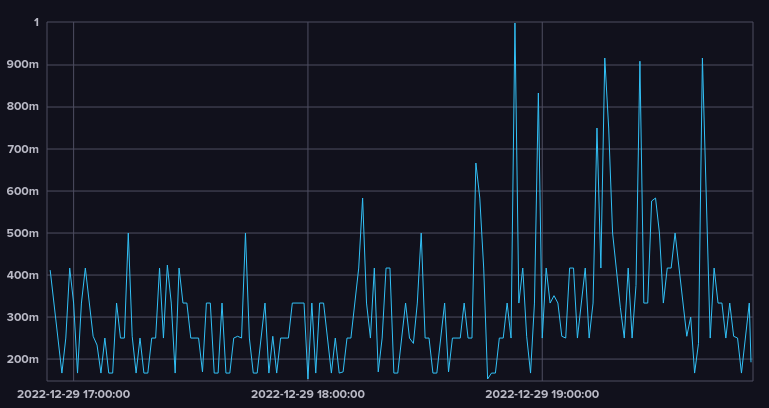
receiver ip address 10.164.85.152 57777 protocol grpc-tcpAnd after a little while…
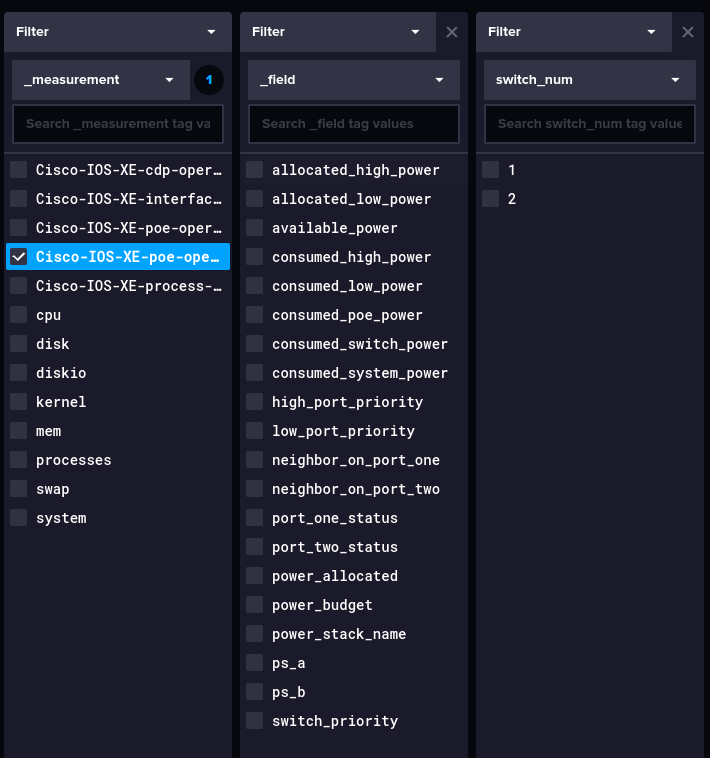
This looks _very_ promising. Maybe we could also set it to send data “on-change” instead of every 10 seconds, although even with all this, CPU usage is still below 1%