
If you’re reading this post, you’re being tracked.
Don’t worry! In this article I’ll explain you exactly how, much better than a vague “privacy policy”.
In this article we will learn to configure Telegraf, influxDB and Grafana to collect and parse json-formatted Nginx logs
What’s a TIG?
TIG stands for Telegraf, InfluxDB, Grafana, and we’re going to see a lot of this in the upcoming posts
Let’s start by creating our pod
podman pod create -n site-analytics -p 8086:8086 -p 3000:3000As usual, with Podman, we need to expose our ports when we create our pod.
We’ll expose 8086 for InfluxDB and 3000 for Grafana.
Create two containers, one for each of those services
podman run -d --pod site-analytics docker.io/influxdb:2.5-alpine
podman run -d --pod site-analytics -v grafana-data:/var/lib/grafana docker.io/grafana/grafana:latest
Next, we’ll configure influxdb.
Configure Influxdb
Go to http://localhost:8086
Fill in your data, choose a name of your liking for Org Name and Bucket
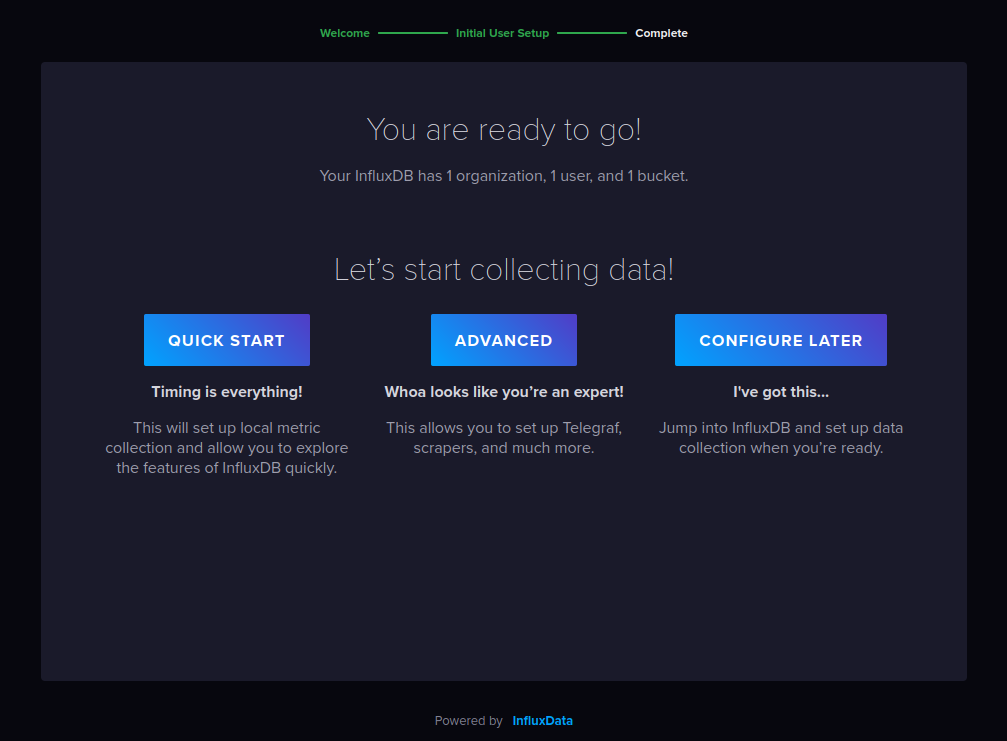
Click “configure later”.
The wizard already set us up with a bucket (in a normal DB this would be a “table”) set to never expire. It’s fine for now.
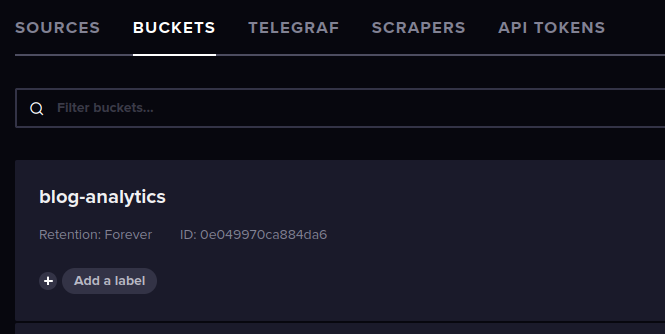
Create a new bucket called “blog-logs” and set to expire after 48 hours so we don’t fill up our disk.
Configure Grafana
Create a token in InfuxDB for Grafana. Give it permissions to “read all buckets”
Open grafana in a new tab. http://localhost:3000.
Login with admin/admin and choose a new password.
Click the cog in the lower left corner and configure a new Influxdb data source.
- Query Language: Flux
- URL: http://localhost:8086
- No Basic Auth
- Organization: what you set before
- Token: paste the token from Influxdb
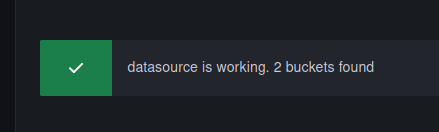
- Save and test
Configure Nginx
We need to tell nginx to save logs in json format.
Open nginx.conf and add this line
log_format json escape=json '{"time": "$msec", "address": "$remote_addr", "method": "$request_method", "uri": "$request_uri", "status": $status, "resp_body_size": $body_bytes_sent, "request_length": $request_length, "user_agent": "$http_user_agent", "resp_time": "$request_time", "referer": "$http_referer"}';With this, logs will be output in this format
{
   "time": "$msec",
   "address": "$remote_addr",
   "method": "$request_method",
   "uri": "$request_uri",
   "resp_body_size": $body_bytes_sent,
   "status": $status,
   "request_length": $request_length,
   "user_agent": "$http_user_agent",
   "resp_time": "$request_time",
   "referer": "$http_referer"
}
Edit the “access_log” setting, adding “json” as desired log format, like so:
access_log /var/log/nginx/access.log json;Reload nginx.
Configure TeleGRAF
Telegraf does not have a web interface. We won’t even install it inside a container, we need it running on the host so it can read nginx’s log file.
Install it locally following their guide.
Generate a new token in Influxdb with write permissions for your bucket.
Let’s first configure Telegraf to output data to InfluxDB in /etc/telegraf/telegraf.conf
[global_tags]

# Configuration for telegraf agent
[agent]
  # send data every 10 seconds
  interval = "10s"
  round_interval = true
  metric_batch_size = 1000
  metric_buffer_limit = 10000
  collection_jitter = "0s"
  flush_interval = "10s"
  flush_jitter = "0s"

  debug = false
  quiet = false

# Configuration for influxdb server to send metrics to
[[outputs.influxdb_v2]]
  urls = ["http://localhost:8086"]
  token = "<token>"
  bucket = "<bucket>"
  organization = "<org>"
Next, we need Telegraf to continuously read nginx’s log file and parse it as json.
In the same file, add:
[[inputs.tail]]
  files = ["/var/log/nginx/access.log"]
  data_format = "json_v2"

  [[inputs.tail.json_v2]]
    name_override = "nginx_access_log"

    [[inputs.tail.json_v2.object]]
      name_override = "nginx_access_request"
      path = "@this"
      timestamp_key = "@this.time"
      timestamp_format = "unix_ms"
Telegraf will read each line as a json “object”. The only thing we need to tell it is where the log timestamp is (“@this.time”) and the format (“unix_ms”)
permission hell
We need to make one more change before we can get our data: nginx’s log files are owned by root and Telegraf can’t read them.
So the first thing to do is assigning group ownership of those files to telegraf’s group, so it can read them
sudo chgrp telegraf /var/log/nginx/access.logUnfortunately this won’t last long.
On Fedora, nginx’s log files are rotated daily by logrotate who also takes care of creating a new file where Nginx can write to, and the permissions are set in logrotate’s configuration, so changing them on the current file is a fix that would only last up to the next run of logrotate.
Logrotate’s config for nginx at /etc/logrotate.d/nginx looks like this
/var/log/nginx/*.log {
    create 0640 nginx root
    daily
    rotate 10
    missingok
    notifempty
    compress
    delaycompress
    sharedscripts
    postrotate
        /bin/kill -USR1 `cat /run/nginx.pid 2>/dev/null` 2>/dev/null || true
    endscript
}
We just need to swap “root” with “telegraf”, save, and that’s it!
Are we done yet?
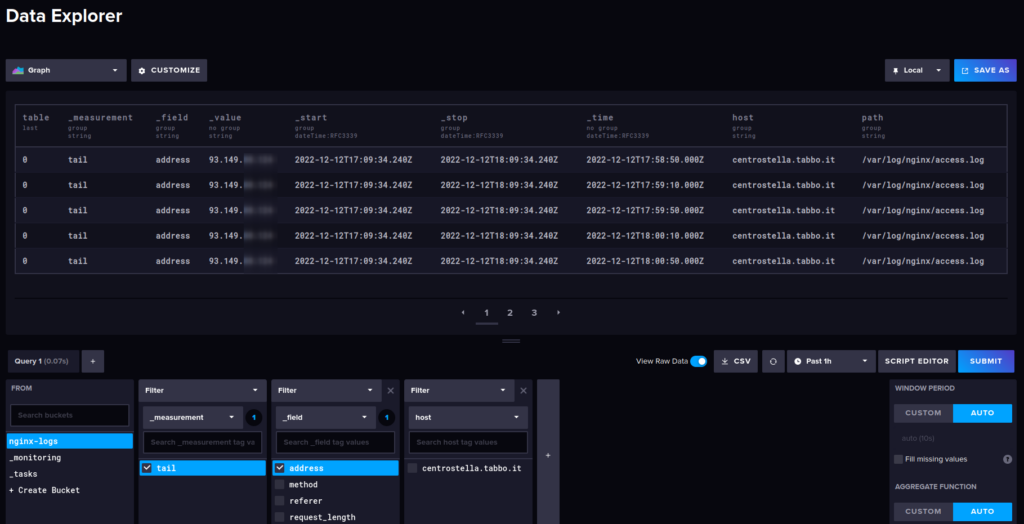
We can finally restart telegraf. After a couple moments we should see our data coming in our Influxdb dashboard!
Next post we’ll figure out what to do with this data.
Once I’ve collected enough, of course